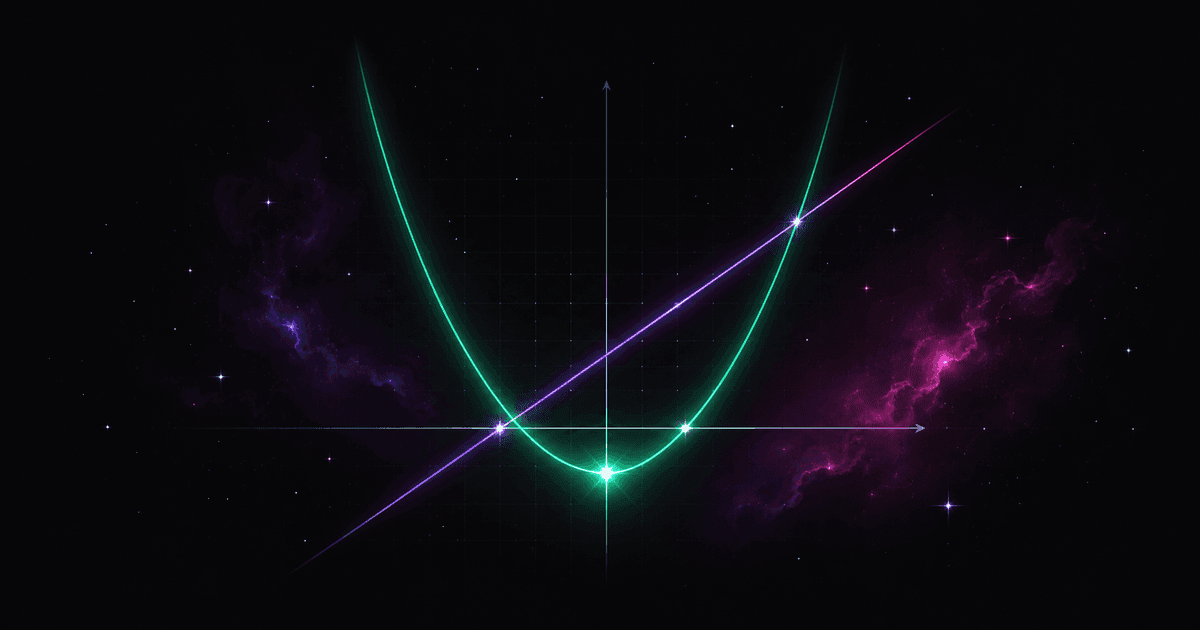
Reading properties from a graph
A graph shows the whole function at once: domain and range, zeros, sign, intervals of monotonicity and the extremum. Learn to read them off the drawing before you compute anything.
Before you start
This topic builds on earlier ideas. Before you start, it's worth working through the lessons below — they'll make everything click:
- Linear functionA linear function y = ax + b draws a straight line. Meet the meaning of the slope and the intercept, the zero, the formula of a line through two points, the general form, and the conditions for parallel and perpendicular lines.
- Quadratic functionA quadratic function f(x) = ax² + bx + c draws a parabola. Meet the vertex and the axis of symmetry, the three forms of the formula — general, canonical and factored — and how the sign of a decides between a minimum and a maximum.
Where this is used
Real situations where you count exactly the way this lesson teaches:
- The weight chart in an appThe app plots 12 weeks of readings. The extreme points on their own say little: a maximum of 84.2 kg in week 3, a minimum of 79.6 kg in week 11. It is the intervals of monotonicity that form a sentence — the curve falls from week 3 to week 11, that is 4.6 kg over 8 weeks, 0.58 kg a week. The last week climbs again, which reading the extremes alone would never have shown.
- Server monitoringAn admin looks at the free-memory chart. The falling interval since midnight shows a leak of 40 MB an hour, and the zero of the function marks the moment nothing is left of the 1.8 GB — 45 hours out. No need to wait for the crash or to know the formula: a slope read off the chart and its crossing of the axis are enough to know the restart has to happen before Friday night.
- An account balanceOn a balance chart it is the sign, not the value, that costs money. The curve drops below the axis on the 18th of the month and comes back above it on the 26th, so the account is overdrawn for 8 days; at 9 per day of overdraft that is 72. The same curve with the same shape, shifted 300 upwards, never crosses the axis and costs nothing.
All formulas
A zero
where the graph crosses the x-axis
The sign of a function
below the axis the values are negative
Increasing function
on an interval where the graph rises
Decreasing function
on an interval where the graph falls
Minimum
the lowest point of the graph; a maximum works the same way
Domain and range
the shadows of the graph on the two axes
A graph carries all the information about a function at once. Before computing anything, six things can be read off it: the domain, the range, the zeros, the sign, the intervals of monotonicity and the extremum.
Domain and range
Both are read as shadows of the graph on the axes:
- the domain — the shadow on the horizontal axis: every argument for which something is drawn;
- the range — the shadow on the vertical axis: every height at which the graph appears.
The parabola above stretches left and right without end, so its domain is every real number. Vertically, though, it only starts at the height and goes up — below the dashed guide there is not a single point of the graph:
The zeros
A zero is an argument whose value is zero — on the graph, a crossing with the -axis:
Our parabola crosses the horizontal axis at and , so the zeros are the numbers and . Note that a zero is the x-coordinate, the bare number , and not the pair .
The sign of a function
The sign is read off the position of the graph relative to the horizontal axis:
- graph above the axis ;
- graph below the axis ;
- graph on the axis .
The boundaries of the sign intervals are always the zeros — only there can the graph cross from one side of the axis to the other. For the line above for and for ; for an increasing function it would be exactly the other way round.
Monotonicity
A function is increasing on an interval when a larger argument has a larger value there:
and decreasing when a larger argument has a smaller value:
On the drawing it is enough to scan from left to right: where the graph rises, the function increases; where it falls, it decreases. Our parabola decreases on and increases on — the boundary is the first coordinate of the vertex.
Two traps of language. First, monotonicity is stated for an interval, never for a single point: with this definition, "does the function increase at ?" is not a meaningful question. Second, "monotonic" does not mean "increasing" — a decreasing function is monotonic too, because it keeps changing in one direction.
The extremum
An extremum is a turning point: where the function stops decreasing and starts increasing (a minimum) or the other way round (a maximum). On the graph it is a valley or a hump.
The value of the extremum is the height of that point, not its -coordinate. For our parabola the minimum is and it is attained at the argument — two different numbers, and mixing them up is the commonest mistake in this lesson.
Value and preimage
The two commonest "pointwise" questions are read along the same path, travelled in opposite directions:
- the value — from the argument on the horizontal axis up to the graph, then across to the vertical axis;
- the preimage — from the value on the vertical axis across to the graph, then down to the horizontal axis.
The difference matters: the value is one (that is the definition of a function), but the same value may be taken by several arguments. On our parabola the value is reached twice and the value only once.
Why read a graph when you can compute
Because computation delivers the properties one at a time, while the drawing shows them all at once. The number of zeros, the sign, the direction of change and the position of the extremum are visible before the delta is computed.
A graph is also the cheapest check on a result: if the computation gave a minimum of while the drawn curve dips below zero, something is wrong. It works both ways — which is why a sketch is worth making even when a problem does not ask for one.
The reading has a limit, though: the drawing shows only the part of the domain that fitted into the frame. If the axis stops at , the graph says nothing about what happens further out — and that is exactly when we go back to the formula.
Exercises
The questions cover three properties this lesson reads off a drawing but which have to be verified by computation: the zeros of a quadratic function, the value of its extremum, and the sign of a linear function. Type the zeros separated by a comma (-1, 3), and the sign as an inequality in the unknown, e.g. x > 2.
Practice
Work through a set of exercises — they get harder as you go. At the end you'll see your score and the mistakes worth reviewing.
Common mistakes
- Giving a point instead of a zero — the zero is the number , not the pair .
- Confusing the value of an extremum with its argument — the minimum is , attained at .
- Swapping domain and range — the domain is the shadow on the horizontal axis, the range on the vertical one.
- Monotonicity at a point — increasing and decreasing are properties of an interval.
- Treating "monotonic" as "increasing" — a decreasing function is monotonic too.
- Reading the sign without the zeros — they are what bounds the sign intervals.
Formula card
Topic: Reading properties from a graph
A zero
where the graph crosses the x-axis
The sign of a function
below the axis the values are negative
Increasing function
on an interval where the graph rises
Decreasing function
on an interval where the graph falls
Minimum
the lowest point of the graph; a maximum works the same way
Domain and range
the shadows of the graph on the two axes