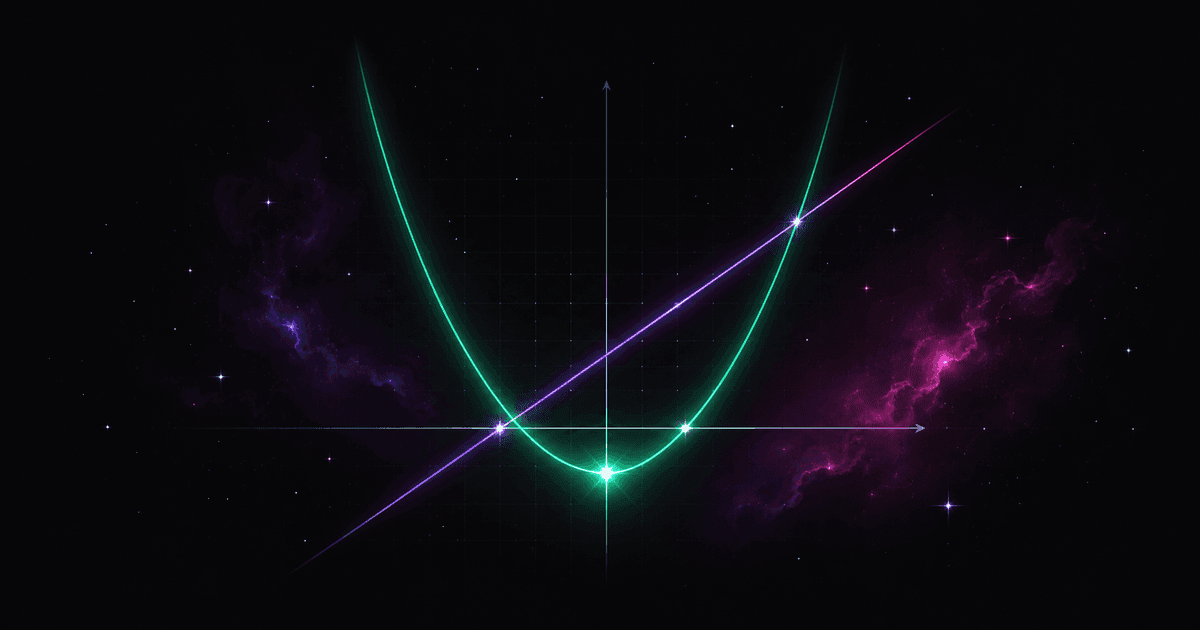
Transforming a graph
One curve, four moves: up, sideways, mirrored in an axis and stretched. See how a change in the formula turns into a movement of the curve, why f(x − 2) shifts the graph to the right rather than the left, and how a plain sine becomes y = a·sin(bx + c) with any amplitude and period you like.
Before you start
This topic builds on earlier ideas. Before you start, it's worth working through the lessons below — they'll make everything click:
- Quadratic functionA quadratic function f(x) = ax² + bx + c draws a parabola. Meet the vertex and the axis of symmetry, the three forms of the formula — general, canonical and factored — and how the sign of a decides between a minimum and a maximum.
- Trigonometric graphsA sine wave is the unit circle unrolled along an axis. See where the period of 2π comes from, why the cosine is a shifted sine, and what happens to the graph of the tangent where the function does not exist.
Where this is used
Real situations where you count exactly the way this lesson teaches:
- Tuning an instrumentA tuning fork sounds A4 at 440 Hz, that is the wave y = a·sin(2π·440·t). The same string pulled tighter sounds 466 Hz — the coefficient beside t grows, so the period drops from 1/440 ≈ 2.27 ms to 1/466 ≈ 2.15 ms. The tuner changes no shape, only one coefficient in the formula; plucking harder changes the amplitude alone, which is the loudness.
- Tides in a harbourThe water level in Gdańsk is modelled by h(t) = 0.3·sin(0.5t) + 2.4, with t in hours. The amplitude 0.3 m is half the difference between high and low water, and the constant 2.4 m is the upward shift, that is the mean sea level. A captain substitutes t = 3 and gets h = 0.3·sin 1.5 + 2.4 ≈ 2.70 m — the depth under the keel three hours from now.
- A ball kicked on a pitchA ball kicked off the ground follows the parabola y = −0.05x² + x. The same kick taken from a 2 m platform is the same curve moved up: y = −0.05x² + x + 2. The vertex rises from 5 m to 7 m and the range grows from 20 m to about 21.8 m — the coach gets the answer without recomputing the trajectory.
- Seasonal sales analysisIce-cream sales across a year are modelled by S(m) = 120·sin(0.52·(m − 4)) + 200 thousand zloty, where m is the month number. The shift by 4 puts the peak in July; the amplitude 120 states the swing about the mean of 200 thousand. An analyst substitutes m = 1 and forecasts S ≈ 200 − 120·0.84 ≈ 99 thousand for January, less than half the mean.
All formulas
Shift along the y-axis
up for q > 0, down for q < 0
Shift along the x-axis
to the right for p > 0 — against the sign in the formula
Translation by a vector
\vec{u} = [p,\, q]
Reflection in the x-axis
flips the sign of the value
Reflection in the y-axis
flips the sign of the argument
Vertical stretch
a times further from the x-axis
Horizontal squeeze
b times closer to the y-axis
The general sinusoid
amplitude |a|, period \tfrac{2\pi}{|b|}, shifted by -\tfrac{c}{b}
Not every curve has to be drawn from scratch. Most graphs you will meet are a handful of familiar shapes shifted, mirrored or stretched — and every one of those moves is visible in the formula.
Shifting along the y-axis
The simplest case: add a number to a finished formula.
Every value grows by , so the whole graph rises by — up for , down for . The shape does not change, because the same amount was added to every value.
For the quadratic function , the formula gives the same parabola with its vertex at instead of at the origin.
Shifting along the x-axis
Here the argument changes, and this is where mistakes happen:
The graph moves units to the right — despite the minus sign. The reason is simple once you have seen it: the new function does at exactly what the old one did at . To recover the old value at zero, you have to travel all the way to .
| formula | what happens |
|---|---|
| three right | |
| three left | |
| three up | |
| three down |
The two middle rows look alike and do opposite things. The sign beside the argument works against intuition; the sign beside the value works with it.
Translation by a vector
Both moves at once make a translation by the vector :
Multiplied out, — the same function, but the general form hides the translation. The vertex form is precisely the spelling in which the shift is written out.
Reflections
Two transformations, two different minus signs:
The first flips the sign of the value — the point goes to , so the graph is reflected in the x-axis. The second flips the sign of the argument — the point goes to , a reflection in the y-axis.
| function | ||
|---|---|---|
| (arms down) | (unchanged — an even function) | |
| (domain ) |
The middle row shows why it pays to compute rather than guess: for the two reflections give different lines.
Stretching and squeezing
Instead of adding, multiply — and again the result depends on which side the multiplier stands.
- stretches the graph along the y-axis: every point moves times further from the x-axis. The zeros stay where they were, because .
- squeezes the graph along the x-axis: what the function used to do over a unit interval it now fits into an interval of length . The intercept on the y-axis stays put.
Once more: the multiplier on the value behaves as you expect, the multiplier on the argument does the opposite. A 2 in front of the function makes the graph twice as tall; a 2 beside makes it twice as narrow.
The general sinusoid
All four moves at once show up best on the sine graph, because a plain has such a recognisable shape:
| coefficient | what it sets | value |
|---|---|---|
| amplitude | ||
| period | ||
| phase shift | ||
| midline |
The phase shift is divided by , not itself — only after factoring out of the bracket can you see how far the argument really travels:
The graph moves to the right, not .
The same three coefficients describe every wave: sound, mains voltage and the water level in a harbour differ only in their values.
Practice
The set checks four things: the formula after a shift or a reflection, the image of a point of the graph (compute first, then move the point), the period of a sinusoid and its value at a point. Write the formula in whichever spelling suits you — (x−2)^2+3 and x^2−4x+7 are both accepted, because they are the same function. Describing a transformation in words ("a translation by the vector…") stays with the worked examples above: its answer is a sentence, not a number.
Practice
Work through a set of exercises — they get harder as you go. At the end you'll see your score and the mistakes worth reviewing.
Common mistakes
- Shifting left for — a minus beside the argument means a move to the right; check it on the vertex or on a zero.
- Confusing with — the first reflects in the x-axis, the second in the y-axis; for an odd function they agree, which is exactly what lulls you into not checking.
- Reading the phase shift off — only says how far the graph travels.
- Believing in changes the period — it changes the amplitude; the period depends on alone.
- Swapping a stretch and a vertical shift — and are two different graphs.
- Forgetting the domain after a reflection — is defined for , however innocent the formula looks.
Formula card
Topic: Transforming a graph
Shift along the y-axis
up for q > 0, down for q < 0
Shift along the x-axis
to the right for p > 0 — against the sign in the formula
Translation by a vector
\vec{u} = [p,\, q]
Reflection in the x-axis
flips the sign of the value
Reflection in the y-axis
flips the sign of the argument
Vertical stretch
a times further from the x-axis
Horizontal squeeze
b times closer to the y-axis
The general sinusoid
amplitude |a|, period \tfrac{2\pi}{|b|}, shifted by -\tfrac{c}{b}