
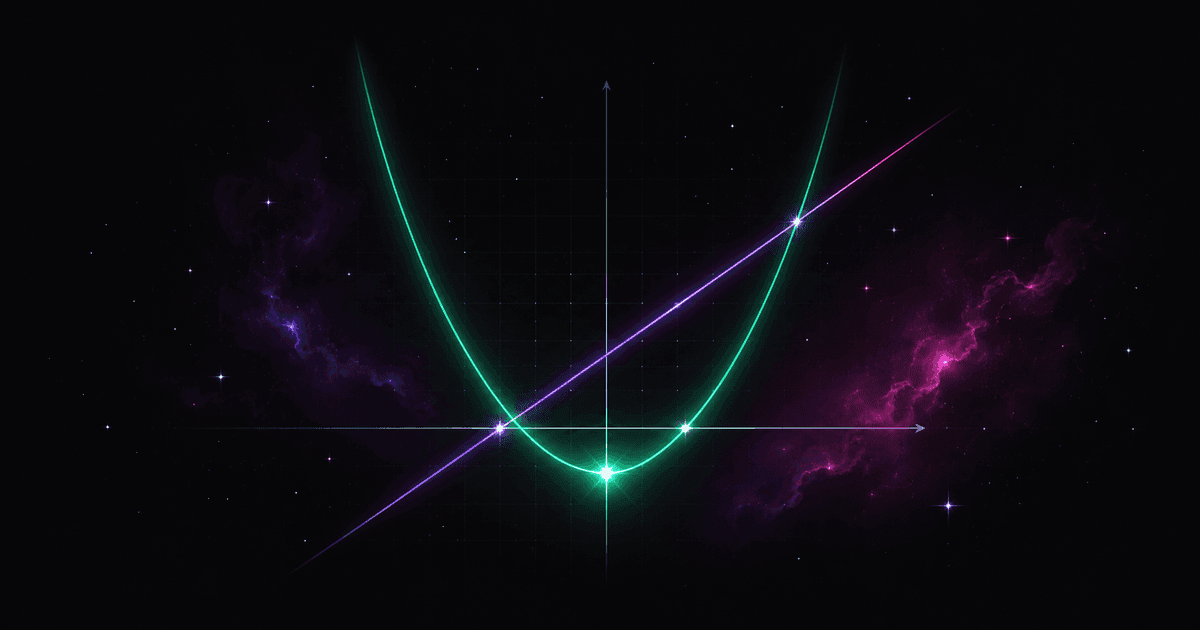
How fast a cup of tea cools depends on time. The cost of a ride depends on the number of kilometres. The height of a thrown stone depends on how many seconds have passed since it left your hand. Mathematics describes every such dependence with a single concept, and that concept carries exactly one requirement: uniqueness. One argument, one value. Not a single one more. This piece is the narrative layer above our functions and analysis branch — where that requirement came from, what follows from it, and why a drawing is the best place to see it.
One rule, one answer
A function is an assignment: to every element of one set — the domain — it assigns exactly one element of another set. We write this f: X → Y, and the value at the argument x is written f(x). It helps to picture a machine: you feed in an argument, a result comes out, and the same argument always yields the same result.
That last clause is the entire definition. If a stone thrown upwards could be at two heights in the same second, the description would stop meaning anything. Physics does not allow it, and mathematics simply calls it not a function.
The condition is, however, asymmetric — and this is where intuition first stumbles. One argument may not have two values, but nothing stops two different arguments from landing on the same value. The classic case is f(x) = x²: both x = 2 and x = −2 give y = 4. That is a perfectly good function; it simply is not one-to-one.
The domain carries a second easily forgotten point: a function must be defined at every one of its elements. So f(x) = 1/x is not a function "on the real numbers" — it is a function on ℝ \ {0}, and zero simply is not in the domain. The domain is not decoration added at the end of an exercise; it is part of what a given function is.
Four ways of saying the same thing
A formula is the most common way to define a function, but not the only one. Equally legitimate are a table (arguments on the left, values on the right), a graph (the set of points (x, f(x)) in the plane), a verbal description, or a diagram of arrows between two sets. A train timetable is a function given by a table, and nobody expects a formula from it.
This has a consequence that was argued over for a century and a half: a function need not be expressible by a single algebraic formula. The rule "return 1 for rational numbers and 0 for irrational ones" is a valid assignment, even though no textbook formula describes it. Definition and notation are two different layers: the uniqueness requirement is strict, while the letter f, the choice of x and y, and whether we write a quadratic in general or vertex form are all conventions.
The vertical line test
Since the graph is the set of points (x, f(x)), the uniqueness condition has to be visible on it. And it is — as the vertical line test: if any line parallel to the y-axis meets the drawn curve at more than one point, that curve is not the graph of a function of x.
The shortest counterexample is the circle x² + y² = r². For every argument strictly inside (−r, r) there are two points: y = √(r² − x²) and y = −√(r² − x²). A circle is a perfectly respectable curve; it just is not the graph of a function. Cut into two semicircles, it yields two functions. Hence the title: a graph may go up, down and flat, but never backwards along the argument axis.
Two notions that exercises confuse constantly are worth separating right here. A zero (or root) is an argument x for which f(x) = 0 — a crossing of the x-axis. The value f(0) is the crossing of the y-axis. Two different axes and two different numbers; substituting zero once for x and once for y gives entirely different results. Definitions, domains and the first reading off a drawing are covered in the lesson on what a function is.
How the concept matured
Today's definition is surprisingly young. Functional thinking in practice is very old: Old Babylonian cuneiform tablets (c. 1800 BC) carry tables of squares, cubes and reciprocals — ready-made assignments, written down without a shred of general theory.
| Figure / era | Step | What it actually contributed |
|---|---|---|
| Old Babylonian tablets (c. 1800 BC) | tables of squares, cubes, reciprocals | assignment in practice, without the concept |
| Nicole Oresme (c. 1320–1382) | Tractatus de configurationibus qualitatum et motuum | the intensity of a quality (latitudo) drawn over its extension (longitudo) — a forerunner of the graph |
| René Descartes (1637) | La Géométrie | curves described by equations: geometry starts speaking algebra |
| Gottfried W. Leibniz (c. 1673) | first use of the word "function" | still geometric: quantities tied to a point on a curve |
| Johann Bernoulli (1718) | the analytic definition | a function is an expression built from a variable and constants |
| Leonhard Euler (1734 / 1748 / 1755) | the f(x) notation, Introductio in analysin infinitorum | the function as the central object of analysis; later a broader definition through dependence |
| P. G. L. Dirichlet (1829 / 1837) | an everywhere-discontinuous function; the relational view | the break with the demand for a single formula |
| Set-theoretic formalism (20th c.) | a function as a set of ordered pairs | today's definition: a subset of a Cartesian product |
Several rows deserve caution, because they circulate in versions that are too smooth. Euler was using the symbol f( ) in papers from the mid-1730s, and the Introductio (1748) spread it — "Euler invented f(x) in 1748" is shorthand. The 1673 date for Leibniz refers to a manuscript, not a publication. The function taking 1 on the rationals and 0 on the irrationals appears in Dirichlet's 1829 paper on trigonometric series; crediting him directly with the modern formal definition has been questioned — Imre Lakatos, among others, pointed out that the original wording is considerably more careful. And the definition by ordered pairs has no single author: it rests on the notion of a pair as treated by Hausdorff (1914) and Kuratowski (1921), and was popularised by the Bourbaki collective, active from the late 1930s.
Constant rate: the linear function
The simplest non-trivial dependence is one in which the increase in value is directly proportional to the increase in the argument:
y = ax + b
The slope a is exactly that rate, Δy / Δx — how much y grows when x grows by one. Geometrically it is the tangent of the angle the line makes with the horizontal x-axis. The sign of a settles monotonicity: a > 0 increasing, a < 0 decreasing, a = 0 constant. The intercept b is the initial value, the point (0, b) where the graph crosses the y-axis.
When b = 0, what remains is y = ax — strict direct proportionality. Only then does doubling the argument really double the result, and only then does the graph pass through the origin. The distinction has practical bite: a bill with a standing charge is not proportional, even though its graph is a straight line.
Hence the popularity of the model:
- Tariffs and subscriptions. A cost
K(x) = a·x + b— a fixed chargebplus a variable part driven by usage. Taxi fares, electricity bills, waste collection. - Uniform motion.
s(t) = v·t + s₀, where the speedvplays the part of the slope ands₀of the starting position. Speed units are their own kind of nuisance, and we have a speed converter for them. - A fixed exchange rate. Converting currency with no commission is
y = k·x, pure proportionality. - Road gradient. A sign reading "8%" literally means
a = 0.08: for every100 mof horizontal distance the ground rises by8 m. It is not a percentage of a full turn, but the ratio of rise to run.
Fitting a line through two points, the perpendicularity condition and reading coefficients off a drawing are the content of the lesson on the linear function.
When the rate itself changes: the parabola
If the rate of change is not constant but itself changes linearly, we get the quadratic function y = ax² + bx + c and its graph, the parabola. It has a turning point, the vertex V = (p, q), where the function attains a minimum (for a > 0) or a maximum (for a < 0). Three equivalent forms show three different things:
| Form | Formula | What it reveals at a glance |
|---|---|---|
| general | y = ax² + bx + c | the y-intercept (0, c) and the direction of the arms from the sign of a |
| vertex | y = a(x − p)² + q | the vertex (p, q), the axis of symmetry x = p, the extreme value q |
| factored | y = a(x − x₁)(x − x₂) | the zeros x₁, x₂ (available when Δ ≥ 0) |
The vertex coordinates come from p = −b/(2a) and q = −Δ/(4a), where Δ = b² − 4ac. Take f(x) = 2x² − 8x + 6:
Δ = (−8)² − 4·2·6 = 64 − 48 = 16, so p = 8/4 = 2 and q = −16/8 = −2
The vertex is V = (2, −2) and the vertex form is f(x) = 2(x − 2)² − 2. Since √Δ = 4, the zeros are x₁ = (8 − 4)/4 = 1 and x₂ = (8 + 4)/4 = 3, giving f(x) = 2(x − 1)(x − 3). All three forms return the same number at every point:
x | −1 | 0 | 1 | 2 | 3 | 4 |
|---|---|---|---|---|---|---|
f(x) = −2x + 6 | 8 | 6 ← y-axis | 4 | 2 | 0 ← zero | −2 |
f(x) = 2x² − 8x + 6 | 16 | 6 ← y-axis | 0 ← x₁ | −2 ← vertex | 0 ← x₂ | 6 |
The same table yields the rest of the quadratic's properties: the range [−2, ∞), decreasing on (−∞, 2] and increasing on [2, ∞), negative values exactly between the zeros, on (1, 3). The whole procedure — axis of symmetry and intervals of monotonicity included — is in the lessons on the quadratic function and on reading properties from a graph; solving the equation ax² + bx + c = 0 itself belongs to algebra, in the lesson on quadratic equations.
The parabola returns outside mathematics in two roles. The first is the path of a projectile: neglecting air resistance, the height of a body follows h(t) = −½gt² + v₀ᵧt + h₀. That caveat is not a formality — a real bullet's trajectory is shorter and markedly asymmetric, and the faster the projectile, the further it strays from a parabola. The second is the focal property: rays travelling parallel to the axis of symmetry converge on a single point after reflecting off a parabolic dish. Headlights, satellite dishes and telescope mirrors all rest on it.
A bridge, a chain, and the commonest mistake about shape
A cable slung between two poles is casually called a parabola, and the main cable of a suspension bridge a catenary. Both claims circulate and both can be wrong, because the shape is decided not by the material but by the distribution of the load.
A perfectly flexible cable loaded only by its own weight — that is, uniformly along its own length — takes the shape of a catenary:
y = a·cosh(x/a) = (a/2)·(e^(x/a) + e^(−x/a))
The same cable loaded uniformly along the horizontal projection takes the shape of a parabola. That is exactly the case in a suspension bridge: the stiff roadway deck weighs many times more than the cable itself and hangs from closely spaced vertical hangers, so the main cable of the Golden Gate is, to a very good approximation, a parabola rather than a catenary. The other way round: a bicycle chain hung over two nails, a power line between pylons, or the Gateway Arch in St. Louis (an inverted, weighted catenary) are catenary cases. For a shallow sag the two curves are in any case so alike that the eye cannot separate them — which explains why the confusion is so durable.
Four datasets, one set of statistics, four different pictures
A graph is not an illustration attached to results; it is sometimes the only place where what is really happening becomes visible. The best proof is Anscombe's quartet, four datasets published in 1973 by the statistician Francis Anscombe. Each has eleven points and practically identical summary statistics: mean x of 9, variance of x of 11, mean y of 7.50, variance of y of about 4.12, a correlation of r ≈ 0.816 and the same regression line y = 3.00 + 0.50x.
| Dataset | What the graph shows |
|---|---|
| I | an ordinary linear relationship with random scatter — the model fits |
| II | an exact quadratic relationship; the regression line here is simply a misunderstanding |
| III | an exact linear relationship spoiled by one outlier that tilts the line |
| IV | ten points share x = 8, the eleventh sits at x = 19 — a single point fixes the entire slope |
That last row is worth reading carefully, because it is often summarised as "a constant x = 9". There is no point at x = 9 at all; nine is the mean produced by ten eights and one nineteen. It is a neat miniature of the whole problem: a number summarising a dataset can describe a situation that does not occur in it.
The same ease of reading gets used in the opposite direction too. The commonest manipulation is a truncated y-axis — a scale that starts somewhere other than zero, so that a two-percent wobble looks like a collapse. The second is changing the aspect ratio: stretching y against x steepens the curve artificially, squeezing it flattens it. The slope in a picture is not a property of the data until you have seen both scales.
Five mistakes that cost the most
| Mistake | Where it comes from | How it actually is |
|---|---|---|
reading f(x) as f · x | brackets look like multiplication | f is the name of a rule, not a number; f(x) is that rule's value at x |
| "every curve is a graph" | a graph pictured as a drawing rather than a set of pairs | only the vertical line test settles it; a circle fails |
confusing a zero with f(0) | both contain a zero | a zero is the x satisfying f(x) = 0 (the x-axis); f(0) is a point on the y-axis |
the sign of a shifts the parabola sideways | mixing up the roles of three coefficients | a sets the direction of the arms and the width; the shifts belong to p and q |
| "monotonic" = "increasing" | shorthand picked up from linear functions | monotonic means direction-preserving: increasing, decreasing, non-increasing or non-decreasing |
What is convention and what is fact
| Element | Character | Why |
|---|---|---|
the letter f and the variables x, y | convention | notational convenience; g, t, v would do just as well |
| the choice of quadratic form | convention | three notations for one function, picked to suit the question |
| the horizontal axis as the argument axis | convention | a convention, but the vertical line test only makes sense given it |
| uniqueness of the assignment | fact | without it, "the value of the function" refers to nothing |
| being defined on the whole domain | fact | the domain is part of the definition, not an afterthought |
p = −b/(2a), q = −Δ/(4a) | fact | they follow from completing the square in the general form |
| a projectile's path is a parabola | conditional fact | only when air resistance is neglected |
A function, then, is a concept built out of a single prohibition — the prohibition of ambiguity — and that was enough to describe cooling tea, an electricity bill, the flight of a stone and the shape of a satellite dish. Next time you see a curve on a chart, it is worth asking it the simplest possible question: does this line double back anywhere?
Further reading
- MacTutor History of Mathematics Archive, University of St Andrews — the entry The function concept and the biographies of Oresme, Euler and Dirichlet.
- Jeff Miller, Earliest Known Uses of Some of the Words of Mathematics — documented first-use dates for the term "function" and the
f(x)notation. - F. J. Anscombe, Graphs in Statistical Analysis, The American Statistician 27 (1973), pp. 17–21 — the four-page paper in which the quartet appeared.
- Edward Tufte, The Visual Display of Quantitative Information, Graphics Press — the classic on honest and dishonest charts.
- Darrell Huff, How to Lie with Statistics — short and still current on the truncated axis and its relatives.
- Delta (deltami.edu.pl) — accessible articles on functions and the history of analysis.
- Khan Academy — the course on functions (khanacademy.org).